Hello, traders! 👋🏻
If price action had a way of saying, “HOLD MY BEER, I’M NOT DONE YET,”— it would be through a flag pattern. This classic continuation setup is where strong trends take a breather before launching their next move. Whether you’re seeing a bullish flag chart pattern or a bearish flag pattern, you’re looking at a market that’s just catching its breath before running again.
Let’s break down how this works and what to watch for!
What Is a Flag Pattern?
A flag pattern forms when the market makes a strong move (called the “flagpole”), then consolidates in a narrow, counter-trend range that looks like a flag. Eventually, the price breaks out in the direction of the original trend.
Think of it like a runner sprinting, slowing down to recover, and then taking off again. That pause? That’s your flag.
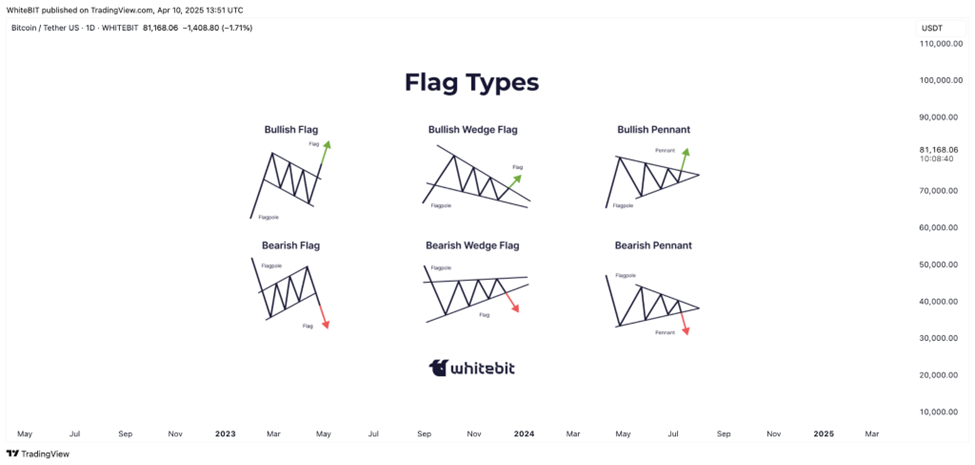
There Are Two Main Types
🟢 Bull Flag Pattern (Bullish Flag Pattern)
It appears after a sharp upward move. The flag part slopes downward or moves sideways.
It also might signal a continuation of the bullish trend. This is the kind of setup that gets traders excited — it’s all about momentum.
🔴 Bear Flag Pattern (Bearish Flag Pattern)
It appears after a sharp downward move. The flag part slopes upward or consolidates sideways. It also might signal a continuation of the bearish trend. When the market pauses in a falling trend, the bear flag pattern warns that sellers are just regrouping before the next drop.
How to Recognize a Flag Chart Pattern
Spotting a Flag Trading Pattern Is Fairly Straightforward — Just Look For:
✔ A Strong Price Move (the Flagpole)
✔ A Tight Consolidation That Slopes Opposite the Trend
✔ Lower Volume During Consolidation
✔ A Breakout in the Direction of the Original Trend
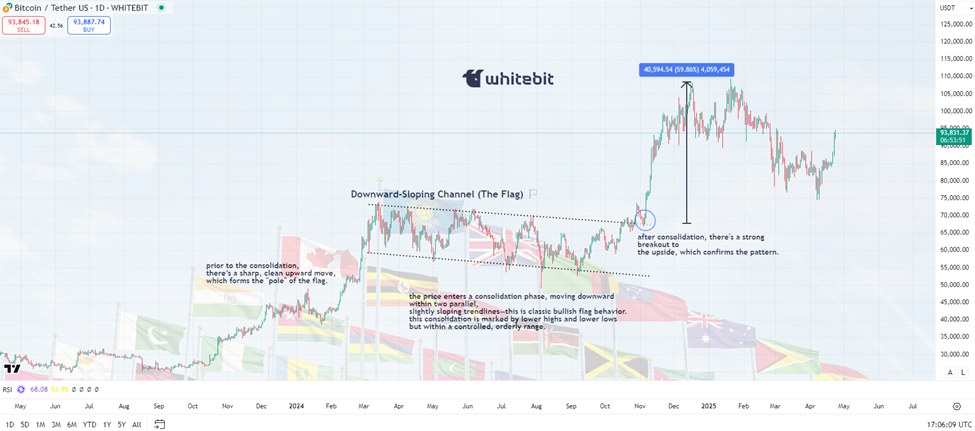
📊 Real Example: BTC Flag Pattern in 2024
Take a look at the chart above. From October to March 2024, Bitcoin made a massive upward move from around $40,000 to $72,000+ — this was the flagpole.
Then, from March through November 2024, BTC entered a long, downward-sloping consolidation channel, forming the flag itself. Despite the lower highs and lower lows, the pullback was contained within parallel trend lines — a classic setup.
Once the price broke above the top of the flag, it kicked off a second leg, surging to a new all-time high above $108,000. That breakout confirmed the bullish flag pattern and rewarded traders who recognized the structure early.
This BTC move is a textbook example of how a bull flag chart pattern plays out in real markets — offering clean entry signals and strong momentum if the pattern completes.
Final Thoughts: Trust the Flag, Not the Noise
The flag chart pattern is a reminder that not every pullback means the trend is over. Sometimes, it’s just the market catching its breath. Whether you’re spotting a bull flag pattern in a crypto rally or a bear flag pattern in a downtrend, learning to trade these setups can possibly add precision to your strategy.
So, next time you see a price taking a nap in a narrow channel, ask yourself: Is this a bullish flag chart pattern gearing up for another leg up? Or is it a bearish flag pattern just waiting to drop the floor out? Let the structure tell the story and the trend do the rest.