A Swing Failure Pattern (SFP) is a technical chart pattern often used in price action trading to identify potential reversals in the market. It is typically seen on candlestick or bar charts in the context of trend analysis.
The basic idea behind a Swing Failure Pattern is that the price temporarily breaks above or below a previous swing high or low, but fails to sustain that move and reverses direction quickly. This indicates a potential shift in market sentiment, and it can be a signal for a trend reversal or breakdown.
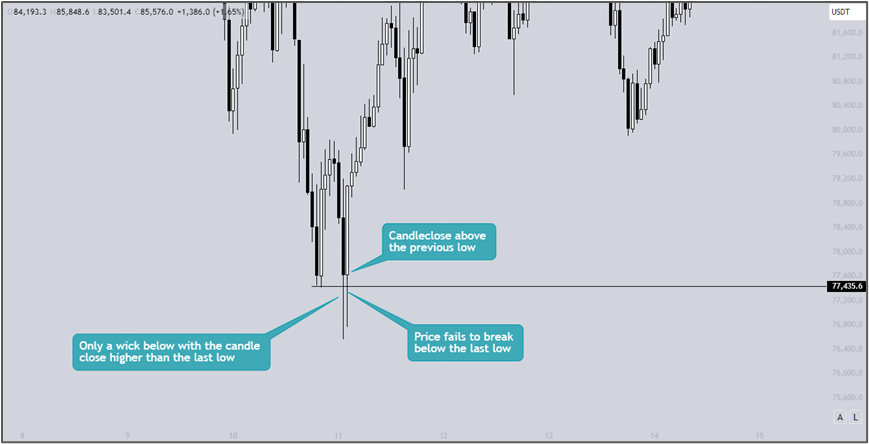
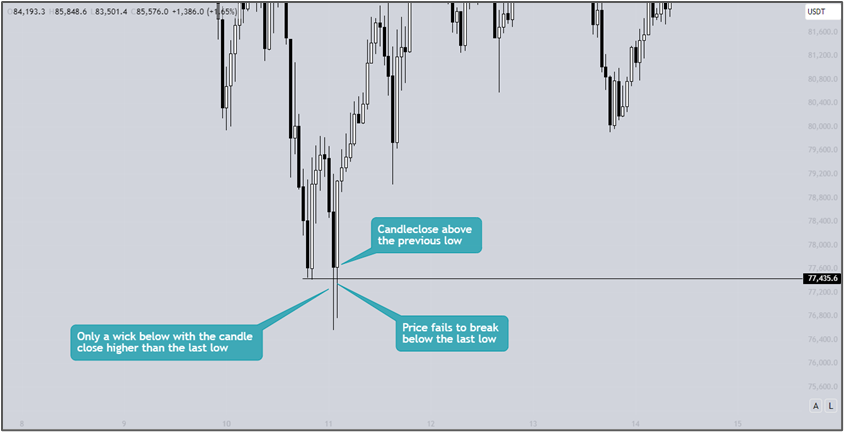
When is it a SFP?
– In needs to sweep the previous low
– It has to close the candlestick above the previous low. So only a wick down When the price closes the body of a candle below the last low, it will not be considered an SFP. In this case, it is highly likely that the trend will continue in that direction.
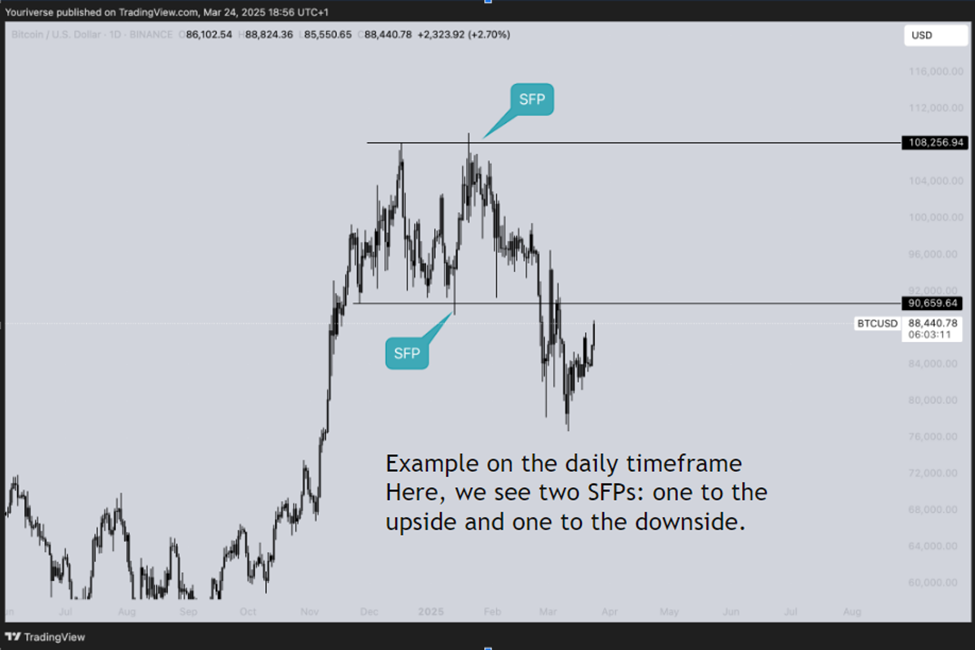
The SFP can occur across various timeframes, from lower to higher timeframes.
Thanks for your support.
– Make sure to follow us so you don’t miss out on the next analysis!
– Drop a like and leave a comment!